More Than Delivery: How Instacart Powers Local Economies

When you order on Instacart, your focus is likely on the fresh fruit, pantry staples, and everyday essentials that show up at your door, seemingly like magic. But you may not realize the powerful economic impact you’re part of every time you tap “place order.” From the grocer restocking their shelves and the shopper earning on their own schedule to the local brand reaching new customers, every order placed has a positive ripple effect in communities across the U.S. and Canada. Each delivery represents a small but meaningful part of something much bigger: the shared grocery economy we’re helping build together.
As we share in our 2025 Economic Impact Report, released today, Instacart began as a way to bring same-day delivery to millions of households. Now, it’s evolved into a dynamic ecosystem that connects and supports everyone in the grocery industry — from the local store to the kitchen table.
We measure our success not just by how many orders we deliver, but by the real-world impact we create for people, businesses, and communities. Our marketplace is built on four interconnected pillars — retailers, shoppers, customers, and CPG brands — and we’re proud to help each of them grow and succeed together.
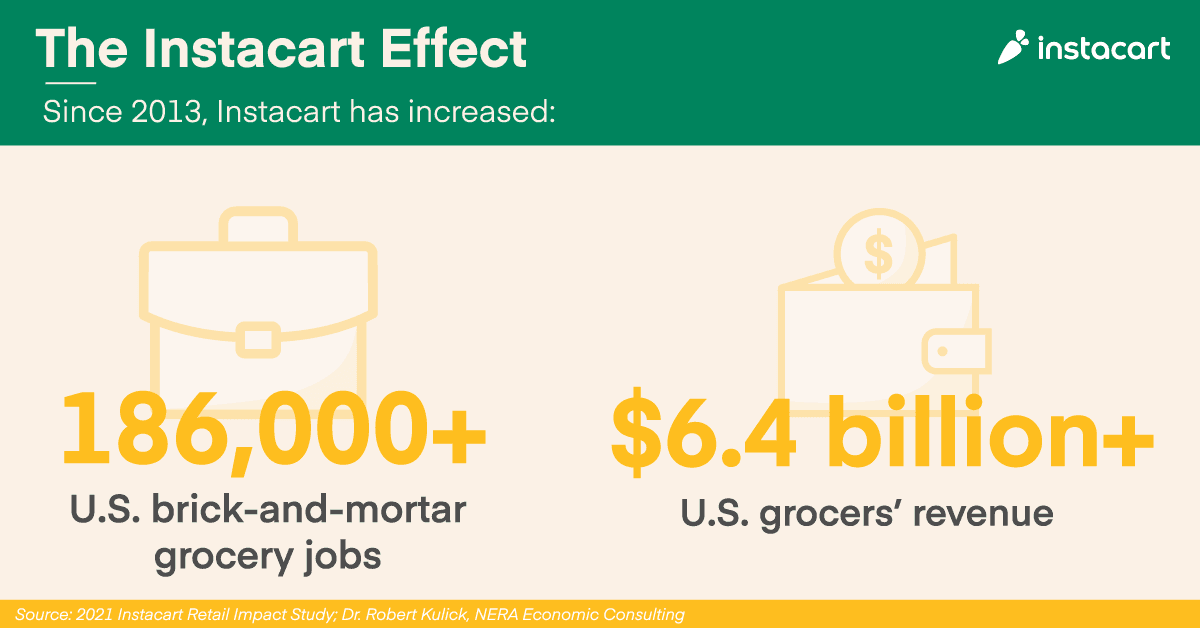
- For grocers, we’ve helped add more than 237,000 grocery jobs and $22.5 billion in revenue since Instacart’s founding in 2012, with small business jobs representing nearly one in every three of those.1
- For customers, we’ve powered more than 1.5 billion orders2, saving families over 1 billion hours3 and more than $3 billion4 through deals, discounts, and loyalty programs.
- For shoppers, we provide approximately 600,000 individuals5 with flexible earning opportunities, and they’ve earned over $24 billion in income6 to help support themselves and their families.
- For brands, we’ve become a leading retail media platform, helping 7,500+ CPG brands7 reach new customers, increase their sales, and scale new products — resulting in a 25% average sales lift8 for brands that advertise on Instacart.
Each of these groups represents a vital side of our marketplace, and when connected through our technology they form a powerful cycle of economic growth and opportunity. The numbers in this report — from jobs created and hours saved to revenue gains and family savings — reflect the tangible, positive impact Instacart helps generate across North America.
And most importantly, behind every statistic are people: a young worker getting their first job in the bakery of a neighborhood grocery store, a shopper earning additional income to care for their family, a family who counts on Instacart because their health doesn’t allow them to shop in store, and a food startup founder reaching new households for the first time. Their stories are why we do what we do.
As we look to the future, our mission remains clear: to create a world where everyone has access to the food they love and more time to enjoy it together. As we pursue that mission, we’ll work tirelessly to continue powering economic opportunity in communities and driving growth across every side of our marketplace. We’re proud of the impact Instacart has made so far — and even more excited for what’s ahead.
- Industry data based on 2025 NERA Economic Consulting study. ↩︎
- As of Q3 2025, number of orders (pick-up or delivery) since Instacart’s entry into the market through September 30, 2025. ↩︎
- As of Q3 2025. Based on both delivery and pick-up orders since Instacart’s entry into the market.
↩︎ - As of Q3 2025. Based on savings data on marketplace orders from Q1 2023 through Q3 2025. The savings calculation accounts for retailers who offer the same as in-store prices as well as retailers where prices on Instacart are higher than in-store prices.
↩︎ - As of Q2 2025. Based on shoppers who completed at least one order during the month ended June 30, 2025.
↩︎ - As of Q2 2025. Based on earnings since Instacart’s entry into the market, inclusive of tips.
↩︎ - As of Q2 2025.
↩︎ - Based on the average of internal tests run across all brand partners during the last four quarters ended September 30, 2025 using an updated methodology with a 28-day lookback period. There can be no assurance that the outcomes for these tests can be maintained or replicated due to a variety of factors, some of which may not be within Instacart’s control or cannot be anticipated.
↩︎

Instacart Recommends
View most recent posts →